

RS9 Systems research · 14 November 2026
Auditing Gene-Identity Shortcuts and the Equilibrium Structural Ceiling in Missense Gain- versus Loss-of-Function Prediction
Gene identity can inflate gain- versus loss-of-function scores. Within genes, the trained models tested here scored ~0.62–0.65.
Changing one amino acid can reduce a protein’s activity (loss of function) or increase it (gain of function). That distinction can affect treatment, including whether blocking the protein would help. Across 112,399 human variants in 1,352 genes, the tested 1,022-letter pipeline drops 26.03% of variants past letter 1,022. A model given only the normal protein scores 0.76 across genes. It falls to 0.49 (0.46 with the mutation included) inside genes where changes work both ways. The larger model with 2,046-letter windows and local structural features scores 0.64, where trained sequence and single-state stability models plateau at ~0.62–0.65.
Scores run from 0.50 (a coin flip) to 1.00 (perfect separation); below 0.50 is worse than guessing.
Author
Dale Richards-Smith, RS9 Systems
Correspondence: [email protected]
Preprint formatted for bioRxiv
Missense directionality · RS9 research
What the study found
What the benchmark tests show.
Finding 1
A 1,022-letter reading limit excludes 26.03% of listed variants.
The tested pipeline reads only the first 1,022 amino acids. Changes after position 1,022 therefore leave its input unchanged. Subtracting the mutant representation from the normal one gives zero. For the matched pathogenic benchmark subset beyond the cutoff, the model’s discrimination score across test folds is 0.50, indicating chance-level separation.
Finding 2
A gene-only model that never sees the mutation scores 0.76 across genes and 0.49 inside them.
Most disease genes in clinical catalogues are recorded almost entirely as broken-off or almost entirely as stuck-on. Handing a classifier only the unmutated protein lets it guess the gene’s usual label (0.76 across genes), yet inside the 60 genes that carry both kinds of disease mutation, the gene-only model scores 0.49 and the mutation-aware 1,022-letter model scores 0.46.
Finding 3
The earlier model scored 0.46; the larger 2,046-letter configuration scored 0.64.
A larger model reading 2,046 letters around the mutation site with local 3D confidence scores across 60 genes at 0.64. Subtracting the mutated sequence from the normal one on the same 38-gene set (0.63 vs 0.65) showed no added signal in our tests. The mechanism learned by the model remains unresolved in this comparison.
Finding 4
Trained 3D stability ensembles stay at ~0.62–0.65 within genes, and 4-chain pores in water do not beat a static model.
Across 38 genes, 52.3% of sampled 3D domain snapshots passed the 7.5 Å quality check, and blending water-based stability scores into trained models stayed flat (0.62 vs 0.62). Assembling 4-chain potassium pores raised kept snapshots from 29% to 75%, yet untrained water stability across three channels still trailed the static structure (0.70 vs 0.72).
Why memorising the gene fails
Nearby variants can have opposite effects.
Variants one to four amino acids apart can increase or reduce the activity of the same protein. The pairs below show how close these sites can be. Select a pair to inspect its position in the structure.
- ABCC84 letters apart
Pancreatic channel regulator · 1,581 letters (both past 1,022)
V1539MGain of functionNeonatal diabetes (switch jammed ON)
L1543PLoss of functionHyperinsulinism (switch broken OFF)
Both sites lie more than 500 amino acids past the 1,022-letter cutoff. The truncated input misses both changes. Knowing the gene alone cannot distinguish their effects on blood sugar.
- KCNJ113 letters apart
Pancreatic potassium pore · slide helix
V59G/MGain of functionNeonatal diabetes (pore propped OPEN)
T62RLoss of functionHyperinsulinism (pore conduction lost)
Separated by one helical turn on the elbow that opens and closes the potassium pore: V59G can be treated with channel-blocking tablets, whereas T62R breaks channel opening in the opposite direction.
- KCNA21 letter apart (3.8 Å)
Brain potassium pore · inner gate hinge
V408G/AGain of functionEpileptic encephalopathy (gate hyperactive)
P407ALoss of functionEpileptic encephalopathy (gate impaired)
Side by side on the hinge that bends to open the channel. Even when all four pore chains are assembled tightly in 3D, scoring a single resting shape in water cannot tell them apart.
Interactive 3D structural audit
See what the 1,022-letter cutoff hides and how the 4-chain pore fits together.
ABCC8 has 31 disease variants beyond the 1,022-letter cutoff, which excludes more than a third of its sequence. Mode B shows how four potassium-channel subunits assemble. Drag to rotate or pinch to zoom. Select a red gain-of-function or blue loss-of-function site for details.
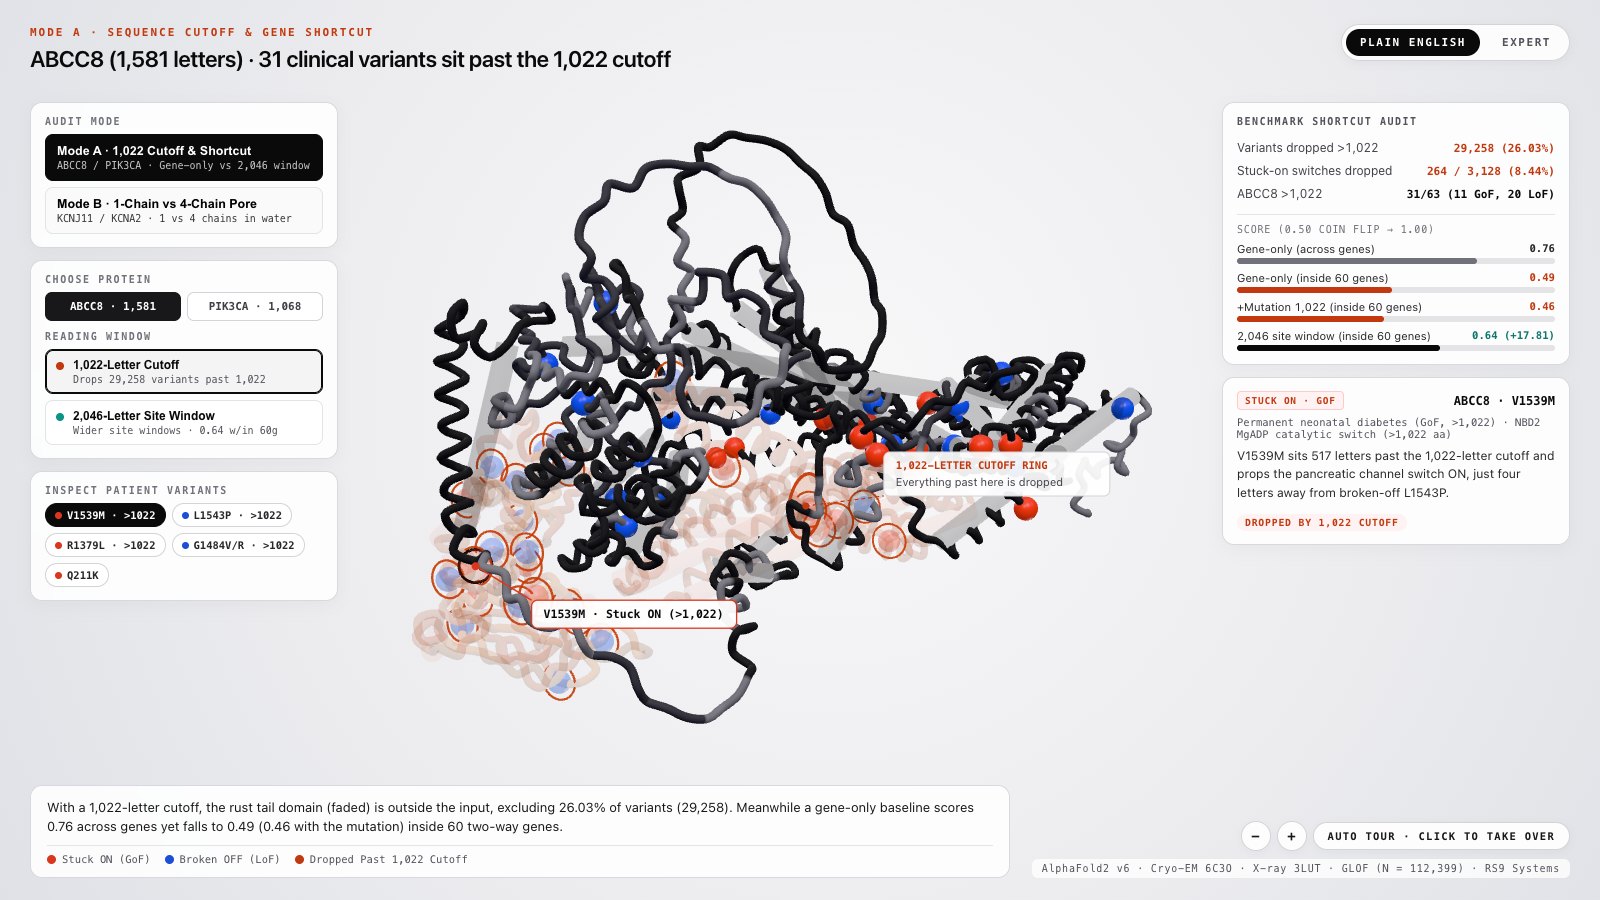
Selected structures
What each regime in the model shows.
View 1
Mode A · ABCC8 (1,581 aa)The 1,022-letter cutoff excludes a third of ABCC8
The red ring marks position 1,022. The faded region falls outside the model input and includes the second energy-sensing domain involved in insulin release. Both diabetes-associated gain-of-function variants and low-blood-sugar-associated loss-of-function variants occur there.
31 of 63 disease mutations in ABCC8 sit past letter 1,022 (11 stuck-on, 20 broken-off).View 2
Mode A · PIK3CA (1,068 aa)Why a one-way cancer gene flatters a gene-only model
Every PIK3CA variant in this catalogue is labelled gain of function. Recognising the gene can therefore earn a correct prediction at sites such as E545 without using the mutation. The cancer-associated cluster around H1047 lies beyond the 1,022-letter cutoff.
All 66 catalogued PIK3CA mutations are stuck-on, with 9 clustered past letter 1,022.View 3
Mode B · 1-Chain Monomer [A]Pulling one channel chain into water exposes greasy walls
When a single potassium-channel subunit is scored alone in water, the amber spheres mark surfaces meant to touch partner chains or fatty membrane. Most sampled snapshots from four isolated pore subunits failed the 7.5 Å shape check, and aqueous scoring may misrepresent membrane-facing sites; that explanation needs a membrane-aware comparison.
Only 7 of 24 single-chain pore snapshots passed the 7.5 Å check (0 of 6 for the KCNJ2 pore).View 4
Mode B · 4-Chain Pore [A,B,C,D]Assembled pores retain more snapshots without improving the score
Sliding the three partner chains into place buries the subunit walls around the teal potassium filter and raises the share of snapshots passing the 7.5 Å check from 29.2% to 75.0%. Yet in KCNA2, locking into one tight resting ring leaves adjacent stuck-on and broken-off hinge mutations looking alike in water.
Kept snapshots rise from 7/24 to 18/24, while the 3-channel untrained score moves from 0.72 static to 0.70.
Benchmark audit & ceiling ladder
Scores after removing benchmark shortcuts.
The audit below separates sequence truncation from gene-identity shortcuts. The chart compares sequence and structural results on the same score scale; 0.50 is chance separation.
26.03%
Dropped counts cover the full catalogue. The model score uses the matched pathogenic benchmark subset.
- Dropped variants
- 29,258 / 112,399
- Dropped stuck-on (GoF)
- 264 (8.44%)
- Dropped broken-off (LoF)
- 3,621
- Benchmark subset >1,022
- 0.50
0.76 → 0.49
0.64 (0.63 vs 0.65)
The 1,022-letter cutoff excludes one in four catalogued variants
The tested pipeline reads the first 1,022 amino acids. This excludes 29,258 variants, including 264 gain-of-function variants near the ends of large kinases and ion channels. In a mutant-minus-normal difference model, every dropped variant has a zero difference. On the matched pathogenic benchmark subset beyond the cutoff, the discrimination score across test folds is 0.50, indicating chance-level separation.
Within-gene ceiling ladder
Trained models cluster at ~0.62–0.65 within genes; untrained 3-pore scores sit on a separate baseline.
Trained sequence models · 60 genes with both mutation types
1,022-letter model (with mutation)
60 genes
Gene-only baseline (no mutation)
60 genes
1,022-letter centered site window
60 genes
384-letter mutant difference + site
60 genes
2,046-letter centered site window
60 genes · +17.81 pts
Trained 3D structure & combined models · 38 genes (whiskers = paired-change interval, shifted by the baseline score)
Proteins longer than 1,022 letters
11 long genes
3D stability only (single static shape)
38 genes
3D stability only (≤7.5 Å snapshots)
38 genes · p = 0.119
Sequence + static 3D stability
38 genes
Sequence + membrane-gated 3D snapshots
38 genes · p = 0.560
Mutant-minus-normal sequence window
38 genes · p = 0.184
2,046-letter normal site window
38 genes
Untrained stability scores (separate baseline · no classifier trained)
Inverted pathogenicity score
38 genes · untrained
Single static 3D stability
38 genes · untrained
Filtered 3D snapshots (≤7.5 Å)
38 genes · untrained
Unfiltered 3D snapshots (all 6)
38 genes · highest 38g untrained
4-chain potassium pore in water
3 pore genes · untrained
1-chain potassium subunit in water
3 pore genes · untrained
Static single potassium subunit
3 pore genes · untrained
The three potassium pores form a separate, smaller cohort. Their untrained stability scores are near 0.70–0.72, while the trained models on the broader gene sets score ~0.62–0.65. Assembling 4 chains in water (0.70) did not beat the single static structure (0.72). The reason for the difference between cohorts remains unresolved.
Whiskers show 95% bootstrap intervals for the paired change, shifted by the comparator mean to share this axis. The intervals describe the paired change. Confidence intervals for each model’s absolute score require a separate calculation.
Why single-state stability stalls
Breaking a safety latch and breaking an engine both look “destabilising” on one resting shape.
Many human signalling proteins sit in a resting state held shut by a built-in safety latch. A mutation that loosens that latch springs the protein ON (gain of function), whereas a mutation that loosens the working core breaks the protein OFF (loss of function). A stability calculator that only inspects one resting structure sees both mutations make that shape less stable. Comparing active and inactive structures in the appropriate membrane environment could help distinguish their effects.
Loosening an inhibitory latch makes the resting shape less stable, tipping the switch into its active shape (for example PIK3CA E545 or KCNJ11 V59G).
Loosening the catalytic core or ion filter also makes the resting shape less stable and destroys function (for example KCNJ11 R136C or ABCC8 L1543P).
| Model / Test Arm | Cohort & Check | Across-Gene Score | Within-Gene Score |
|---|---|---|---|
| Gene-only baseline (never sees mutation) | 60 genes · family holdout | 0.76 → 0.68 | 0.49 |
| 1,022-letter model (with mutation) | 60 genes · family holdout | 0.75 → 0.67 | 0.46 |
| 1,022-letter centered site window | 60 genes · family holdout | 0.66 | 0.58 |
| 2,046-letter centered site window | 60 genes · family holdout | 0.70 | 0.64 (+17.81 pts) |
| 384-letter mutant difference vs normal window | 38 genes · p = 0.18 | 0.70 | 0.63 vs 0.65 |
| Sequence + membrane-gated 3D snapshots vs static | 38 genes · 182/348 ≤7.5 Å | Not tested | 0.62 vs 0.62 |
| Proteins longer than 1,022 letters | 11 long genes · trained | Not tested | 0.52 / 0.53 |
| 4-chain potassium pore in water vs static | 3 pore genes · untrained (18/24 ≤7.5 Å) | Not tested | 0.70 vs 0.72 |
Methods and provenance
How the benchmark was checked.
Related genes were held out together. We checked tabular features for gene-identity leakage and checked sampled domain structures against a structural-deviation threshold. Within-gene evaluation then compared variants with opposite effects on the same protein.
- Cohort & <30% family holdouts
- The catalogue contains 112,399 variants across 1,352 human genes. We tested 14,037 matched disease variants by holding out individual genes and by holding out related gene families sharing under 30% sequence similarity. We then scored variants within 60 genes carrying both directions.
- Removing protein-wide shortcuts
- We removed features that reveal whole-protein identity, including length and average structural confidence. Regression tests checked for remaining shortcuts before the within-gene evaluation.
- 2,046-letter windows & mutant deltas
- Centered 2,046-letter site windows were compared against 1,022-letter windows and against explicit 384-letter mutant-minus-normal difference windows trained on the same cohorts.
- 3D domain ensembles & 7.5 Å check
- For 38 genes (1,347 variants in 58 protein domains), six 3D snapshots per domain were generated and relaxed to remove atomic clashes. They were checked against a 7.5 Å deviation cutoff before scoring stability changes.
- 4-chain potassium pore control
- The study modelled four potassium channels (140 pore variants) both as isolated 152-letter single chains and as assembled 608-letter 4-chain pores to separate partner-chain contact effects from water-scoring limits.
- Paired resampling & multiple testing
- Every 38-gene comparison uses 10,000 paired gene-level resamples and two-sided rank tests. Correction covers all 24 structural tests.
Limits and scope
Changes associated with the +17.81 point gain
The 0.46 to 0.64 within-gene comparison changes language model size and doubles the sequence window from 1,022 to 2,046 letters. It also replaces global pooling with local site features, so the contribution of each change is unknown.
Large proteins past residue 1,022 stay near coin flip
With wider site windows and added 3D domain structures, within-gene scores across the 11 multi-domain proteins longer than 1,022 letters still only reach 0.52–0.53.
No single conformer filter wins every setting
The 7.5 Å structural check failed for 47.7% of sampled 3D domain snapshots; five genes kept zero snapshots. Without training, unfiltered snapshots score 0.61 within genes versus 0.60 for filtered snapshots.
Mutant differences and ensemble fusion stopped adding signal
Subtracting the mutated sequence from the normal one (0.63 vs 0.65) and blending 3D stability ensembles with sequence features (0.62 vs 0.62) both stopped adding signal in our tests.
Assembled pores retain more snapshots
Assembling 4-chain potassium pores raised the share of snapshots passing the 7.5 Å check from 29% to 75%, yet untrained stability scores across three channels still trailed the single static model (0.70 vs 0.72). These experiments used water-based scoring; they did not test whether membrane-aware scoring improves prediction.
A proposed test of active and inactive states
A mutation can destabilise the protein core or loosen a structure that holds it inactive. Comparing active and inactive states in a membrane could help distinguish those effects. That approach remains untested in this study.
Checks for interpreting a gain- versus loss-of-function benchmark
Report a gene-only baseline
Test a model given only the unmutated protein to measure inflation from gene memorisation.
Hold out related gene families (<30% similarity)
Keep related genes in the same fold to limit label transfer between close relatives.
Report variants past residue 1,022 separately
Report scores for variants past letter 1,022 separately from scores for shorter proteins.
Score within genes carrying both directions
Evaluate models within genes carrying both stuck-on and broken-off mutations. Gene identity alone cannot distinguish those mutations.
Data and code
We obtained variant catalogues and protein coordinates from public scientific archives. We sampled structures, checked features and performed paired resampling tests. The manuscript gives the dataset details and results.
Cite this work
Dale Richards-Smith. Auditing Gene-Identity Shortcuts and the Equilibrium Structural Ceiling in Missense Gain- versus Loss-of-Function Prediction. RS9 Systems preprint, 14 November 2026. https://rs9.com.au/research/missense-directionality
Correspondence: [email protected]
What comes next
Testing active and inactive states
A model can score well across genes by learning which label is common for each gene. Within-gene evaluation asks whether it can distinguish variants that have opposite effects on the same protein.
The trained models tested here reached ~0.62–0.65 within genes. A next experiment would compare active and inactive structures, with membrane proteins scored in a lipid environment. Whether that improves prediction remains untested in this study.